Operating without tracking hostel KPIs metrics is like driving blindfolded. You sense something is off — occupancy feels lower, bookings seem slower, revenue is not where it should be — but you cannot diagnose why. Was it pricing? Competition? Reviews? A seasonal dip? Without key performance indicators, you are reacting to symptoms rather than solving root causes.
After 20 years managing hostels across eight European cities, we have learned that the difference between a hostel running at 65% occupancy and one running at 86% is rarely the property itself. It is whether the owner knows which metrics to monitor, how often to check them, and what action to take when they move. Data transforms intuition into strategy. Strategy transforms random decisions into consistent growth.
This guide covers the seven hostel KPIs that matter most, why they matter, how to measure them, and — most importantly — what to do when each one changes.
Why hostel KPIs metrics are different from hotel KPIs metrics
Before diving into specific metrics, it is essential to understand why hostel performance measurement differs fundamentally from hotel performance measurement. Using hotel KPIs in a hostel context leads to incorrect conclusions and poor decisions.
Hostels sell beds, hotels sell rooms
The most fundamental difference: hostels sell individual beds as units of inventory. Hotels sell entire rooms.
This changes the math:
- A 60-bed hostel with 6-bed dorms has 10 rooms but 60 units of sale
- A 60-room hotel has 60 units of sale
- The hostel can sell 5 of 6 beds at different prices to different guests
- Occupancy is measured at bed level, not room level
This is why the core revenue metric for hostels is RevPAB (Revenue Per Available Bed), not RevPAR (Revenue Per Available Room). Using RevPAR in a hostel context is meaningless because the unit of analysis is wrong.
Hostels depend on reviews more heavily than hotels
Review scores have disproportionate impact in hostels compared to hotels.
Why: OTA ranking algorithms (Booking.com, Hostelworld) weight guest ratings heavily. A hostel with 9.2 rating will rank higher in search results than a hostel with 8.5 rating, all else equal. Higher ranking = more visibility = more bookings.
In hotels, brand recognition, loyalty programs, and corporate contracts dilute the impact of individual review scores. In independent hostels, review score IS the primary brand signal.
This makes guest satisfaction score a critical KPI that must be monitored weekly.
Hostels operate with higher staff turnover
Staff rotation in hostels is typically higher than in hotels. This affects consistency, which affects guest experience, which affects reviews, which affects occupancy.
A useful operational KPI for hostels is staff check-in consistency — measuring average time to complete check-in across shifts. If check-in time varies wildly (8 minutes one shift, 22 minutes another shift), guest experience is inconsistent, which shows up in reviews.
Hostels optimize for different guest demographics
Hotels target business travelers, families, and leisure guests with predictable booking windows and expectations.
Hostels target backpackers, digital nomads, budget travelers, and social travelers. These segments value different things: WiFi speed, workspace availability, community events, flexible check-in, social atmosphere.
This means KPIs like Average Length of Stay (ALOS) and repeat guest rate carry different meaning in hostels. Longer ALOS in a hostel signals strong community and programming. Shorter ALOS might signal transactional experience.
The “Big Three” KPIs every hostel must track
If you track nothing else, track these three. They are non-negotiable for any hostel that wants to operate profitably and grow.
KPI 1: Occupancy rate
Definition: The percentage of available beds sold over a given period.
Formula: (Beds sold ÷ Total beds available) × 100
Why it matters:
Occupancy is the primary driver of revenue. A hostel with zero occupancy generates zero revenue regardless of pricing strategy. Every percentage point of occupancy improvement directly translates to revenue.
But occupancy alone is incomplete. A hostel at 95% occupancy selling beds at €10 is worse off than a hostel at 75% occupancy selling beds at €30. This is why occupancy must always be analyzed alongside ADR and RevPAB.
Onefam benchmark: 86% average occupancy across 18 properties
Industry context: Independent hostels typically run 60–75% annual occupancy. Onefam’s 86% is achieved through consistent operations, strong reviews, and active revenue management.
What to do if occupancy drops:
First check: Did competition change? New hostel opened nearby? Competitor launched aggressive pricing?
Second check: Did reviews drop? If review score fell 0.3+ points in past 30 days, OTA ranking likely dropped, which reduces visibility.
Third check: Did an event end? Conference season over? Holiday period ended? Compare to same period last year.
Fourth check: Is pricing misaligned? Are you priced 20%+ higher than comparable hostels? Check competitor rates.
How often to monitor: Daily. Occupancy pickup pace (how fast beds fill for upcoming dates) is an early warning signal. If pickup is slower than normal 14 days out, you have time to adjust.
KPI 2: Average Daily Rate (ADR)
Definition: The average revenue earned per bed sold per night.
Formula: Total bed revenue ÷ Total beds sold
Why it matters:
ADR reveals pricing effectiveness. It shows whether your revenue management strategy — dynamic pricing, upselling, promotional offers — is working.
ADR that is too low means you are leaving money on the table. ADR that is too high relative to competitors means you are pricing yourself out of bookings.
ADR must be analyzed by segment: weekday vs. weekend, season, booking window (last-minute vs. advance), and room type (dorm vs. private).
Onefam benchmark: €22–26 ADR depending on city and season
- Barcelona and Madrid: €24–28
- Prague and Porto: €18–22
- Amsterdam and London: €26–32
What to do if ADR drops:
First check: Are you discounting to fill occupancy? Reactive pricing (lowering rates when occupancy is low) is common but dangerous. It signals desperation and trains the market to expect lower prices.
Second check: Did OTA commission rates increase? If Booking.com raised commission from 15% to 18%, effective ADR after commission drops even if nominal rate stays same.
Third check: Did upselling stop? Are staff still offering private room upgrades? Are activity bookings down? Check training and incentives.
Fourth check: Is channel mix shifting? If more bookings come from high-commission channels (Hostelworld 20%) vs. direct (0%), effective ADR after commission drops.
How often to monitor: Weekly. ADR fluctuates daily based on occupancy and demand, but weekly trends reveal whether pricing strategy is working.
KPI 3: Revenue Per Available Bed (RevPAB)
Definition: Total room revenue divided by total available beds.
Formula: (Occupancy rate × ADR) OR (Total bed revenue ÷ Total available beds)
Why it matters:
RevPAB is the single most important metric for hostels. It captures the interaction between occupancy and rate, revealing true yield performance.
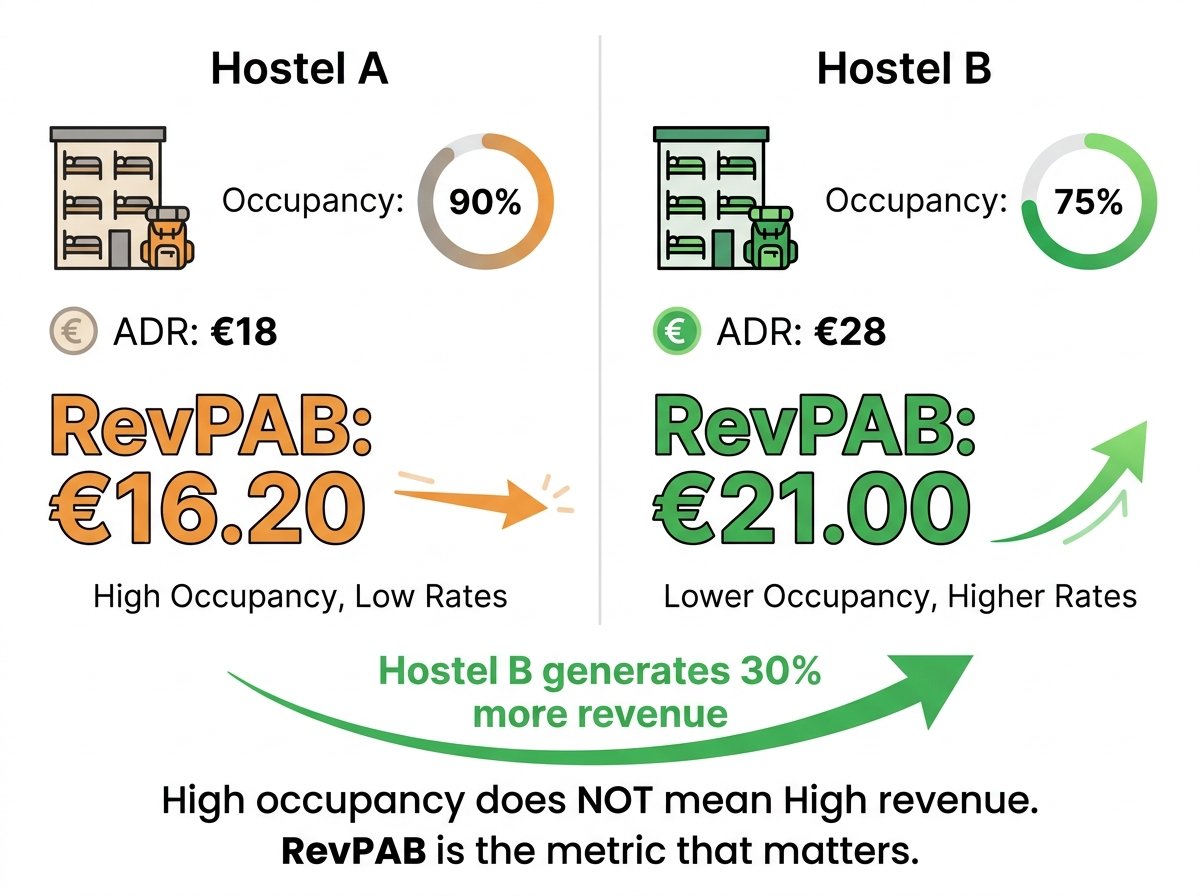
Two hostels can have identical occupancy but vastly different RevPAB:
- Hostel A: 90% occupancy × €18 ADR = €16.20 RevPAB
- Hostel B: 75% occupancy × €28 ADR = €21 RevPAB
Hostel B generates 30% more revenue per bed despite 15 percentage points lower occupancy. This is the power of pricing strategy.
RevPAB is also the metric that allows apples-to-apples comparison across properties of different sizes. A 40-bed hostel and a 100-bed hostel can both achieve €24 RevPAB, meaning they are equally efficient at monetizing inventory.
Onefam benchmark: €62 RevPAB
This is significantly higher than industry average (€35–45) because Onefam balances high occupancy (86%) with competitive ADR (€22–26 depending on market) and benefits from strong review scores driving organic demand.
What to do if RevPAB drops:
Diagnose which component is moving:
If occupancy dropped but ADR stable: Market demand problem or visibility problem. Actions: Check competitors, review OTA ranking, run promotional campaign, adjust channel strategy, consider partnerships.
If ADR dropped but occupancy stable: Pricing problem. Actions: Review discount strategy, test rate increase on low-demand days, analyze competitor pricing, check upselling effectiveness.
If both dropped: Crisis mode. Diagnose root cause: Did reviews tank? New competitor? Operational failure? Seasonal anomaly?
If occupancy up but ADR dropped more: You are discounting too aggressively. Revenue is falling despite higher volume. Tighten pricing.
How often to monitor: Weekly. RevPAB trends over 4–6 weeks reveal whether your overall strategy (occupancy vs. rate balance) is working.
The “Important Four” KPIs for operations and guest experience
The Big Three measure financial performance. The Important Four measure operational health and guest satisfaction — the inputs that drive financial performance.
KPI 4: Guest satisfaction score / Review rating
Definition: Average rating across Booking.com and Hostelworld.
Why it matters:
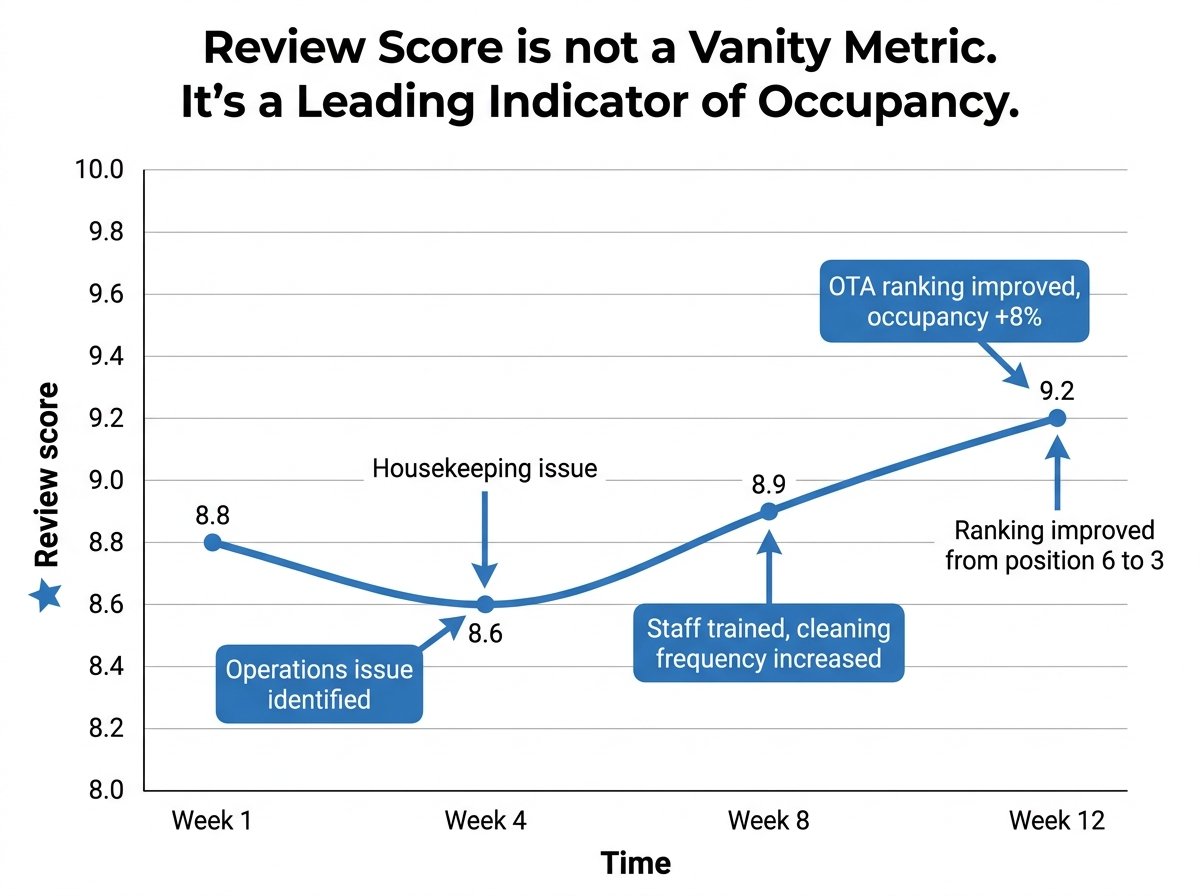
Review score is the most powerful leading indicator of future occupancy. A hostel with 9.2+ rating will consistently rank higher in OTA search results than a hostel with 8.5 rating. Higher ranking = more visibility = more bookings.
Review score also signals operational quality. If scores drop, something broke: cleaning standards, staff responsiveness, facilities, WiFi, noise management. The reviews themselves tell you what broke.
Onefam benchmark: 9.4 average review score
Industry context: 9.0+ is competitive, 8.5 is struggling, 8.0 is crisis. Every 0.1 point matters because OTA algorithms are sensitive to score changes.
What to do if review score drops:
First: Read the 1-star and 2-star reviews. Do not focus on averages. Focus on what is failing. Is it cleanliness? Staff? Noise? WiFi? Identify the pattern.
Second: Categorize issues. Housekeeping issues = training or checklist problem. Staff issues = hiring or culture problem. Facility issues = maintenance backlog.
Third: Implement fix immediately. If housekeeping is the issue, audit cleaning procedures, retrain staff, increase inspection frequency. Track improvement.
Fourth: Respond to every negative review within 24 hours. Professional, empathetic, solution-focused. Never defensive. This signals to future guests that you listen and care.
Fifth: Monitor recovery. It takes 3–4 weeks for fixes to show up in new reviews. Track score weekly to confirm recovery.
How often to monitor: Daily (scroll new reviews), weekly (analyze trends), monthly (calculate average and compare to prior month).
KPI 5: Average Length of Stay (ALOS)
Definition: Average number of nights per booking.
Formula: Total guest-nights ÷ Total number of bookings
Why it matters:
Longer stays reduce operational burden. Each check-in and check-out consumes staff time. Fewer turnovers = more efficient operations.
Longer stays also correlate with higher guest satisfaction. Guests who extend their stay are signaling they enjoy the experience. Guests who leave after one night often had suboptimal experience or found better alternative.
ALOS varies by hostel type and location. City center hostels catering to weekend travelers: 1.5–2 nights. Hostels with strong programming and digital nomad appeal: 3–5 nights.
Industry benchmark: 1.8–2.2 nights average
Onefam target: 2.5+ nights
Achieved through strong community programming (weekly dinners, activities, social events) and facilities that support longer stays (workspaces, fast WiFi, kitchen access).
What to do if ALOS drops:
First check: Is programming weak? Are you running regular community activities? Do guests have reasons to stay longer than transactional accommodation?
Second check: Is staff not engaging socially? Staff energy and social facilitation directly influence whether guests feel connected and want to stay.
Third check: Are room quality or cleanliness issues driving early departures? Guests who leave after one night despite booking three often experienced something unacceptable.
Fourth check: Is pricing too high? Guests check in, realize better options exist, and leave early or do not extend.
How often to monitor: Monthly. ALOS trends over 8–12 weeks reveal whether community and programming are working.
KPI 6: Direct booking percentage
Definition: Percentage of bookings made directly through hostel website rather than OTA.
Formula: (Direct bookings ÷ Total bookings) × 100
Why it matters:
Direct bookings carry zero commission. OTA bookings cost 15–20% commission. A 10% shift from OTA to direct bookings improves net revenue by 1.5–2%.
Direct bookings also mean you own the guest relationship. You have their email, you can market to them directly, and you can encourage repeat bookings without paying commission again.
Industry benchmark: 15–25% direct booking rate for independent hostels
Onefam target: 35%+
Achieved through email capture, retargeting campaigns, referral incentives, and competitive pricing on direct channel.
What to do if direct booking percentage drops:
First check: Is your website booking engine broken or slow? Test the booking flow on mobile and desktop. Abandoned cart rate above 60% signals friction.
Second check: Are OTA rates lower than direct rates? Rate parity is essential. If OTAs show lower rate than your direct site, guests will book there.
Third check: Is email capture and retargeting working? Are you capturing emails at check-in? Are you sending post-stay emails with direct booking incentive?
Fourth check: Is direct booking incentive compelling? “Book direct and save 10%” or “Free breakfast on direct bookings” moves the needle. Weak or absent incentive means guests default to OTA.
How often to monitor: Monthly. Direct booking percentage changes slowly. Monthly trends reveal whether your direct strategy is working.
KPI 7: Cost Per Occupied Bed (CPOB)
Definition: Total operating costs divided by number of beds occupied.
Formula: Total operating costs ÷ Beds occupied
Why it matters:
CPOB reveals operational efficiency. If CPOB is rising while ADR is flat, margins are being compressed. This is unsustainable.
CPOB helps set pricing floors. If CPOB is €15 and you are selling beds at €18, your margin is only €3 per bed before fixed costs. You cannot afford to discount further without going underwater.
Industry benchmark: Varies significantly by city
- Barcelona: €12–18
- London: €18–25
- Prague: €10–15
What to do if CPOB increases:
First check: Are labor costs rising? Wage increases or higher staff turnover (more training time) increase CPOB. Compare current staff costs to prior period.
Second check: Are utility costs spiking? Seasonal (winter heating, summer cooling) or facility issues (leaking water, inefficient HVAC) drive utility costs up.
Third check: Did OTA commission rates increase? If Booking.com raised commission, CPOB effectively increased even if other costs are flat.
Fourth check: Is occupancy dropping while fixed costs stay same? CPOB rises mechanically when fewer beds absorb the same fixed cost base.
How often to monitor: Monthly. CPOB trends over 3–6 months reveal whether operational efficiency is improving or degrading.
How the Big Three KPIs connect: the virtuous cycle
The Big Three — occupancy, ADR, and RevPAB — do not exist in isolation. They are interconnected through operations and guest experience.
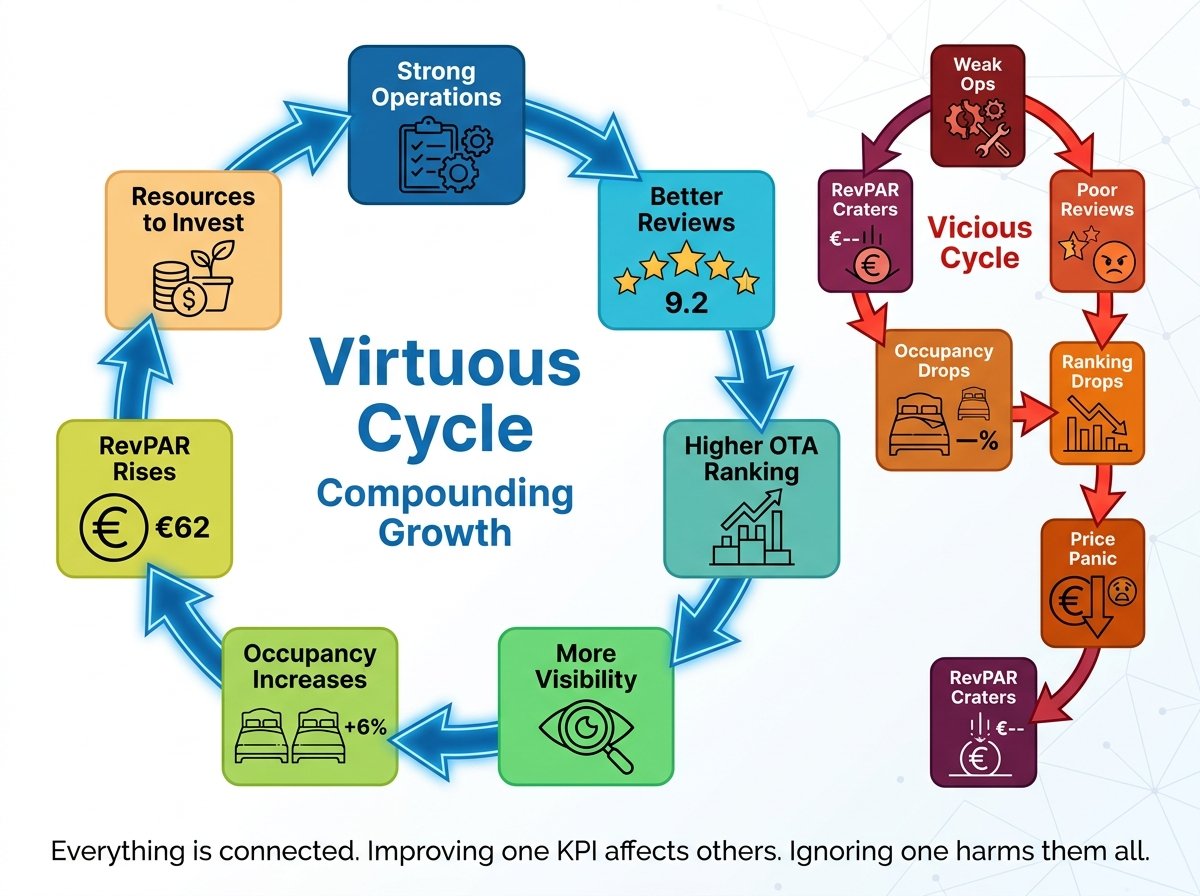
Here is how the virtuous cycle works:
Step 1: Strong operations (documented SOPs, trained staff, consistent quality) → Guests notice quality
Step 2: Guests leave positive reviews → Average review score improves (e.g., 8.8 → 9.2)
Step 3: Higher review score → OTA ranking improves → Visibility increases → More guests discover the hostel
Step 4: Increased visibility → Occupancy rises (e.g., 78% → 84%)
Step 5: Higher occupancy → Stronger negotiating position with OTAs → Ability to maintain or increase rates
Step 6: Consistent operations + strong demand → ADR remains stable or increases slightly
Step 7: Higher occupancy + stable/rising ADR → RevPAB increases significantly
Step 8: Higher RevPAB → More resources to invest in operations, staff training, facilities → Step 1 repeats
The cycle compounds. Each improvement drives the next.
Conversely, the vicious cycle:
Weak operations → Poor reviews → Ranking drops → Visibility falls → Occupancy plummets → Panic pricing (heavy discounts) → ADR collapses → RevPAB craters → No resources to fix operations → Cycle worsens
This is why KPIs must be monitored as a system, not in isolation. Improving one KPI while ignoring another rarely works.
How frequently to monitor each KPI
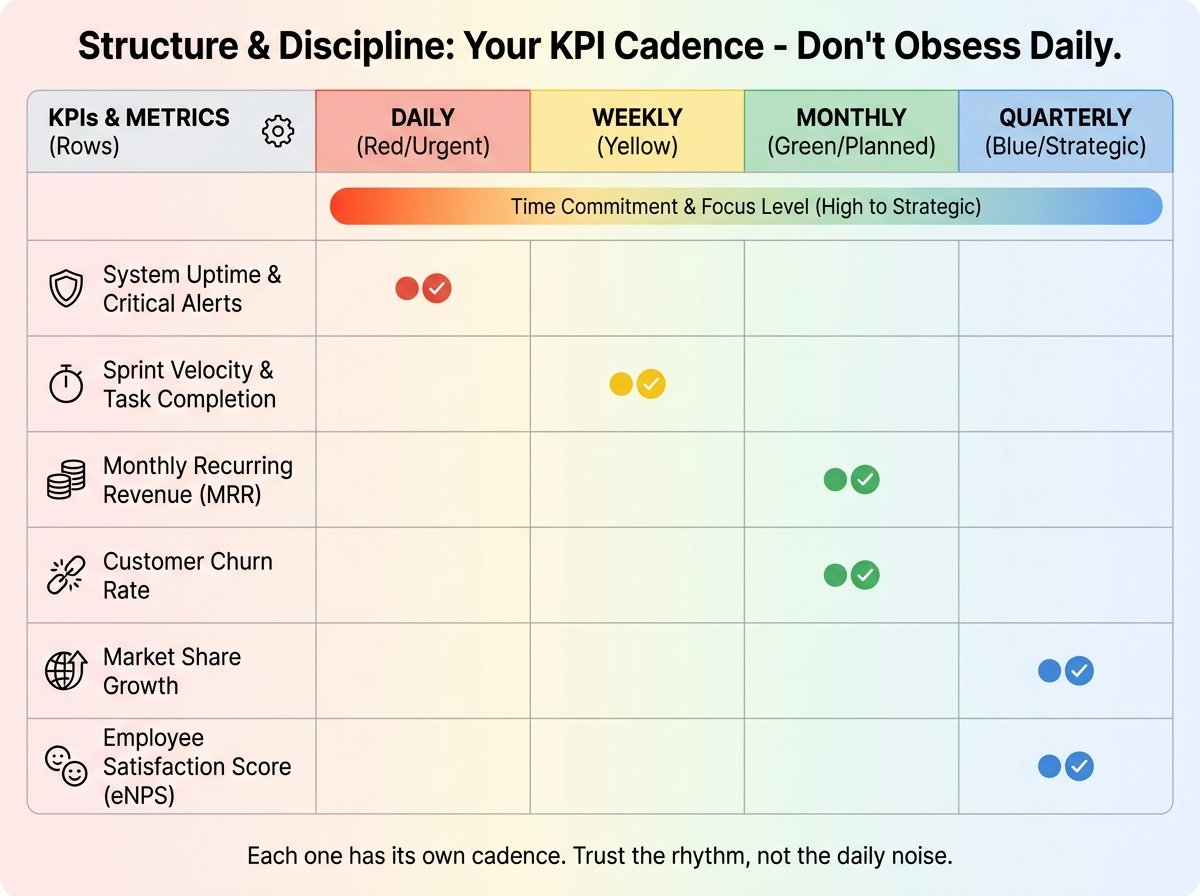
Not all KPIs need daily attention. Here is the monitoring cadence that works:
| KPI | Daily | Weekly | Monthly | Quarterly |
|---|---|---|---|---|
| Occupancy rate | ✅ Check pickup pace | ✅ Analyze trends | ||
| ADR | ✅ Monitor rates | ✅ Review strategy | ||
| RevPAB | ✅ Calculate & trend | ✅ Compare to target | ||
| Review score | ✅ Read new reviews | ✅ Calculate average | ✅ Trend analysis | |
| ALOS | ✅ Calculate | |||
| Direct booking % | ✅ Analyze channel mix | |||
| CPOB | ✅ Calculate & compare | |||
| Seasonal patterns | ✅ Plan for next year |
Daily monitoring (15 minutes): Quick pulse check. Scroll new reviews, check occupancy for next 7–14 days, verify rates are set correctly.
Weekly monitoring (30–60 minutes): Deeper analysis. Calculate weekly RevPAB, review ADR trends, analyze review score movement, look for patterns.
Monthly monitoring (2–3 hours): Full strategic review. Compare month-over-month performance, analyze channel mix, calculate CPOB, identify action items for next month.
Quarterly monitoring (half day): Strategic planning. Analyze seasonal trends, compare year-over-year, adjust annual strategy, plan staffing and pricing for next quarter.
Tools for tracking hostel KPIs
Where do you get the data?
Property Management System (PMS):
Most modern hostel PMS platforms (Mews, Cloudbeds, Hostaway, others) provide built-in reporting for occupancy, ADR, RevPAB, and booking source.
These systems integrate directly with OTAs, so channel data flows automatically. Export reports weekly or monthly for analysis.
OTA dashboards:
Booking.com and Hostelworld each provide partner dashboards showing:
- Your current ranking in search results
- Review score and recent reviews
- Booking pace vs. competitors
- Visibility metrics
Check these weekly to understand how OTA algorithms are treating your property.
Simple spreadsheet:
Many independent operators track KPIs manually in Google Sheets. This works well for single-property operations. Track weekly:
- Beds sold
- Revenue
- Occupancy rate
- ADR
- RevPAB
- Review score
Chart trends over 12–24 weeks to visualize patterns.
Advanced dashboards (multi-property operators):
Once you operate 3+ properties, manual tracking becomes unsustainable. Multi-property operators need:
- Real-time visibility across all properties
- Anomaly alerts (occupancy dropping faster than normal)
- Benchmarking across properties
- Predictive analytics (forecast next 30 days based on pickup pace)
This is where centralized hostel management services provide infrastructure advantage: unified dashboards, automated alerts, cross-property insights.
Using KPIs to make decisions: three real examples
Theory is useful. Application is essential. Here are three real scenarios showing how KPI data drives decisions.
Example 1: RevPAB dropping but occupancy stable
Scenario: 60-bed hostel in Barcelona. RevPAB dropped from €24 to €20 over 6 weeks. Occupancy remained stable at 82%.
Diagnosis: ADR problem, not occupancy problem. If occupancy is stable but RevPAB dropped, ADR must have dropped.
Investigation: Checked pricing strategy. Found that staff had been offering 20% discounts to fill last-minute inventory. Discount rate intended for slow periods was being applied broadly.
Action: Tightened discount policy. Trained staff on when discounts are appropriate. Implemented rule: no discounts if occupancy for that night is above 75% as of 48 hours prior.
Result: ADR recovered to €23 within 4 weeks. RevPAB normalized to €23 × 82% = €18.86. Still below target, but discount abuse was eliminated.
Example 2: Occupancy dropping but reviews stable
Scenario: 80-bed hostel in Prague. Occupancy dropped from 78% to 68% over 8 weeks. Review score remained stable at 9.1.
Diagnosis: Market problem, not operations problem. If reviews are stable but occupancy drops, external factors are at play.
Investigation: Checked competitors. Found that two new hostels had opened within 1km, both pricing aggressively (€2–3 below our rates) to build occupancy.
Action: Did not panic price. Instead, launched targeted campaign emphasizing unique attributes (rooftop bar, daily activities, central location). Adjusted OTA listing to highlight differentiators. Negotiated better placement with Hostelworld.
Result: Occupancy recovered to 74% within 6 weeks. Not back to original 78%, but stable at new competitive equilibrium. Avoided race-to-bottom pricing.
Example 3: Review score tanking despite stable occupancy
Scenario: 100-bed hostel in Amsterdam. Review score dropped from 9.0 to 8.6 over 4 weeks. Occupancy remained at 85%.
Diagnosis: Operations breaking down. If occupancy is stable but reviews tank, something internal failed.
Investigation: Read all 1-star and 2-star reviews from past month. Pattern emerged: 70% of negative reviews mentioned “dirty bathrooms” and “slow check-in.”
Action: Audited housekeeping procedures. Found that bathroom cleaning frequency had dropped from every 90 minutes to every 3 hours during busy periods. Staff was cutting corners due to understaffing.
Hired additional housekeeping staff. Reinstated 90-minute bathroom cleaning rounds. Retrained front desk on check-in speed (target <12 minutes).
Result: Review score recovered to 8.9 within 5 weeks as new reviews reflected improved cleanliness and faster check-in. Occupancy remained stable, and recovery continued toward 9.0+ target.
Conclusion
Hostel KPIs transform gut feeling into data. Data transforms reactive decisions into proactive strategy. Strategy transforms inconsistent results into predictable growth.
Start with the Big Three: occupancy rate, ADR, and RevPAB. Understand them deeply. Watch how they interact. Then layer on the Important Four: review score, ALOS, direct booking percentage, and CPOB.
Track daily where it matters (occupancy pickup, new reviews). Analyze weekly (RevPAB trends, ADR movement). Review monthly (full performance picture). Adjust quarterly (strategic planning).
The hostels that consistently outperform their markets share one thing: they measure religiously. They know their numbers. They see patterns before they become crises. They act on data rather than instinct.
If you are operating one hostel and struggling to build KPI discipline, start simple: track the Big Three in a spreadsheet weekly. Review monthly. Adjust based on what the numbers tell you. This alone will put you ahead of 70% of independent operators who fly blind.
If you are operating multiple properties and need centralized dashboards, real-time alerts, and predictive analytics, that is the inflection point where professional hostel management services — specifically the data infrastructure, cross-property benchmarking, and anomaly detection — become high-ROI investments.
Frequently asked questions
What are the most important KPIs for a hostel? The three most critical KPIs for any hostel are occupancy rate (percentage of beds sold), Average Daily Rate or ADR (revenue per bed sold), and Revenue Per Available Bed or RevPAB (total revenue divided by available beds). RevPAB is the single most important metric because it captures the interaction between occupancy and pricing. Two hostels can have identical occupancy but vastly different RevPAB depending on pricing strategy.
What is RevPAB and why does it matter more than occupancy? RevPAB stands for Revenue Per Available Bed. It is calculated as (Occupancy Rate × ADR) or (Total Revenue ÷ Available Beds). RevPAB matters more than occupancy alone because it reveals true yield performance. A hostel at 90% occupancy selling beds at €15 generates €13.50 RevPAB. A hostel at 70% occupancy selling beds at €28 generates €19.60 RevPAB — 45% more revenue despite lower occupancy. RevPAB shows whether your pricing strategy is working.
How often should you monitor hostel KPIs? Occupancy rate and ADR should be checked daily (15 minutes) to monitor pickup pace and rate positioning. RevPAB and review scores should be analyzed weekly (30–60 minutes) to catch trends early. Direct booking percentage and Cost Per Occupied Bed should be reviewed monthly (2–3 hours) for strategic adjustments. Seasonal patterns and year-over-year comparisons should be analyzed quarterly.
What is a good occupancy rate for a hostel? Industry average for independent hostels is 60–75% annual occupancy. Well-managed hostels in competitive markets achieve 80–85%. Onefam’s 19-property average is 86%, achieved through consistent operations, strong review scores (9.4 average), and active revenue management. Occupancy above 90% may signal underpricing — you could raise rates and still maintain high occupancy.
How do hostel KPIs differ from hotel KPIs? The fundamental difference is inventory unit: hostels sell beds, hotels sell rooms. This makes RevPAB (per bed) the key metric for hostels vs RevPAR (per room) for hotels. Hostels also depend more heavily on review scores because OTA ranking algorithms weight ratings heavily, and independent hostels lack brand recognition. Additionally, hostels track metrics like Average Length of Stay (ALOS) differently — longer stays signal strong community in hostels, while hotels optimize for turnover.
Onefam Hostels manages 19 properties across eight European cities, maintaining 86% average occupancy and 9.4 review scores through disciplined KPI tracking and data-driven decision making. We monitor the Big Three (occupancy, ADR, RevPAB) daily, review operational KPIs weekly, and conduct full performance reviews monthly. If you are exploring how professional hostel management services use centralized dashboards and predictive analytics to optimize performance across multiple properties, contact us at partnership@onefamhostels.com.